Unlock a decade of financial mastery with comprehensive 10 year histories
for balance sheets, cash flows, ratios, and dividend yields.
Filter the Market Your Way
Whether you are a dividend seeker or a growth chaser, our trading platform narrows down thousands of stocks in seconds.

A Decade of Data in Every Search
Gain an unfair advantage with a complete 10-year forensic view of any company’s health:

Step 1: Log in to your Share Trading account
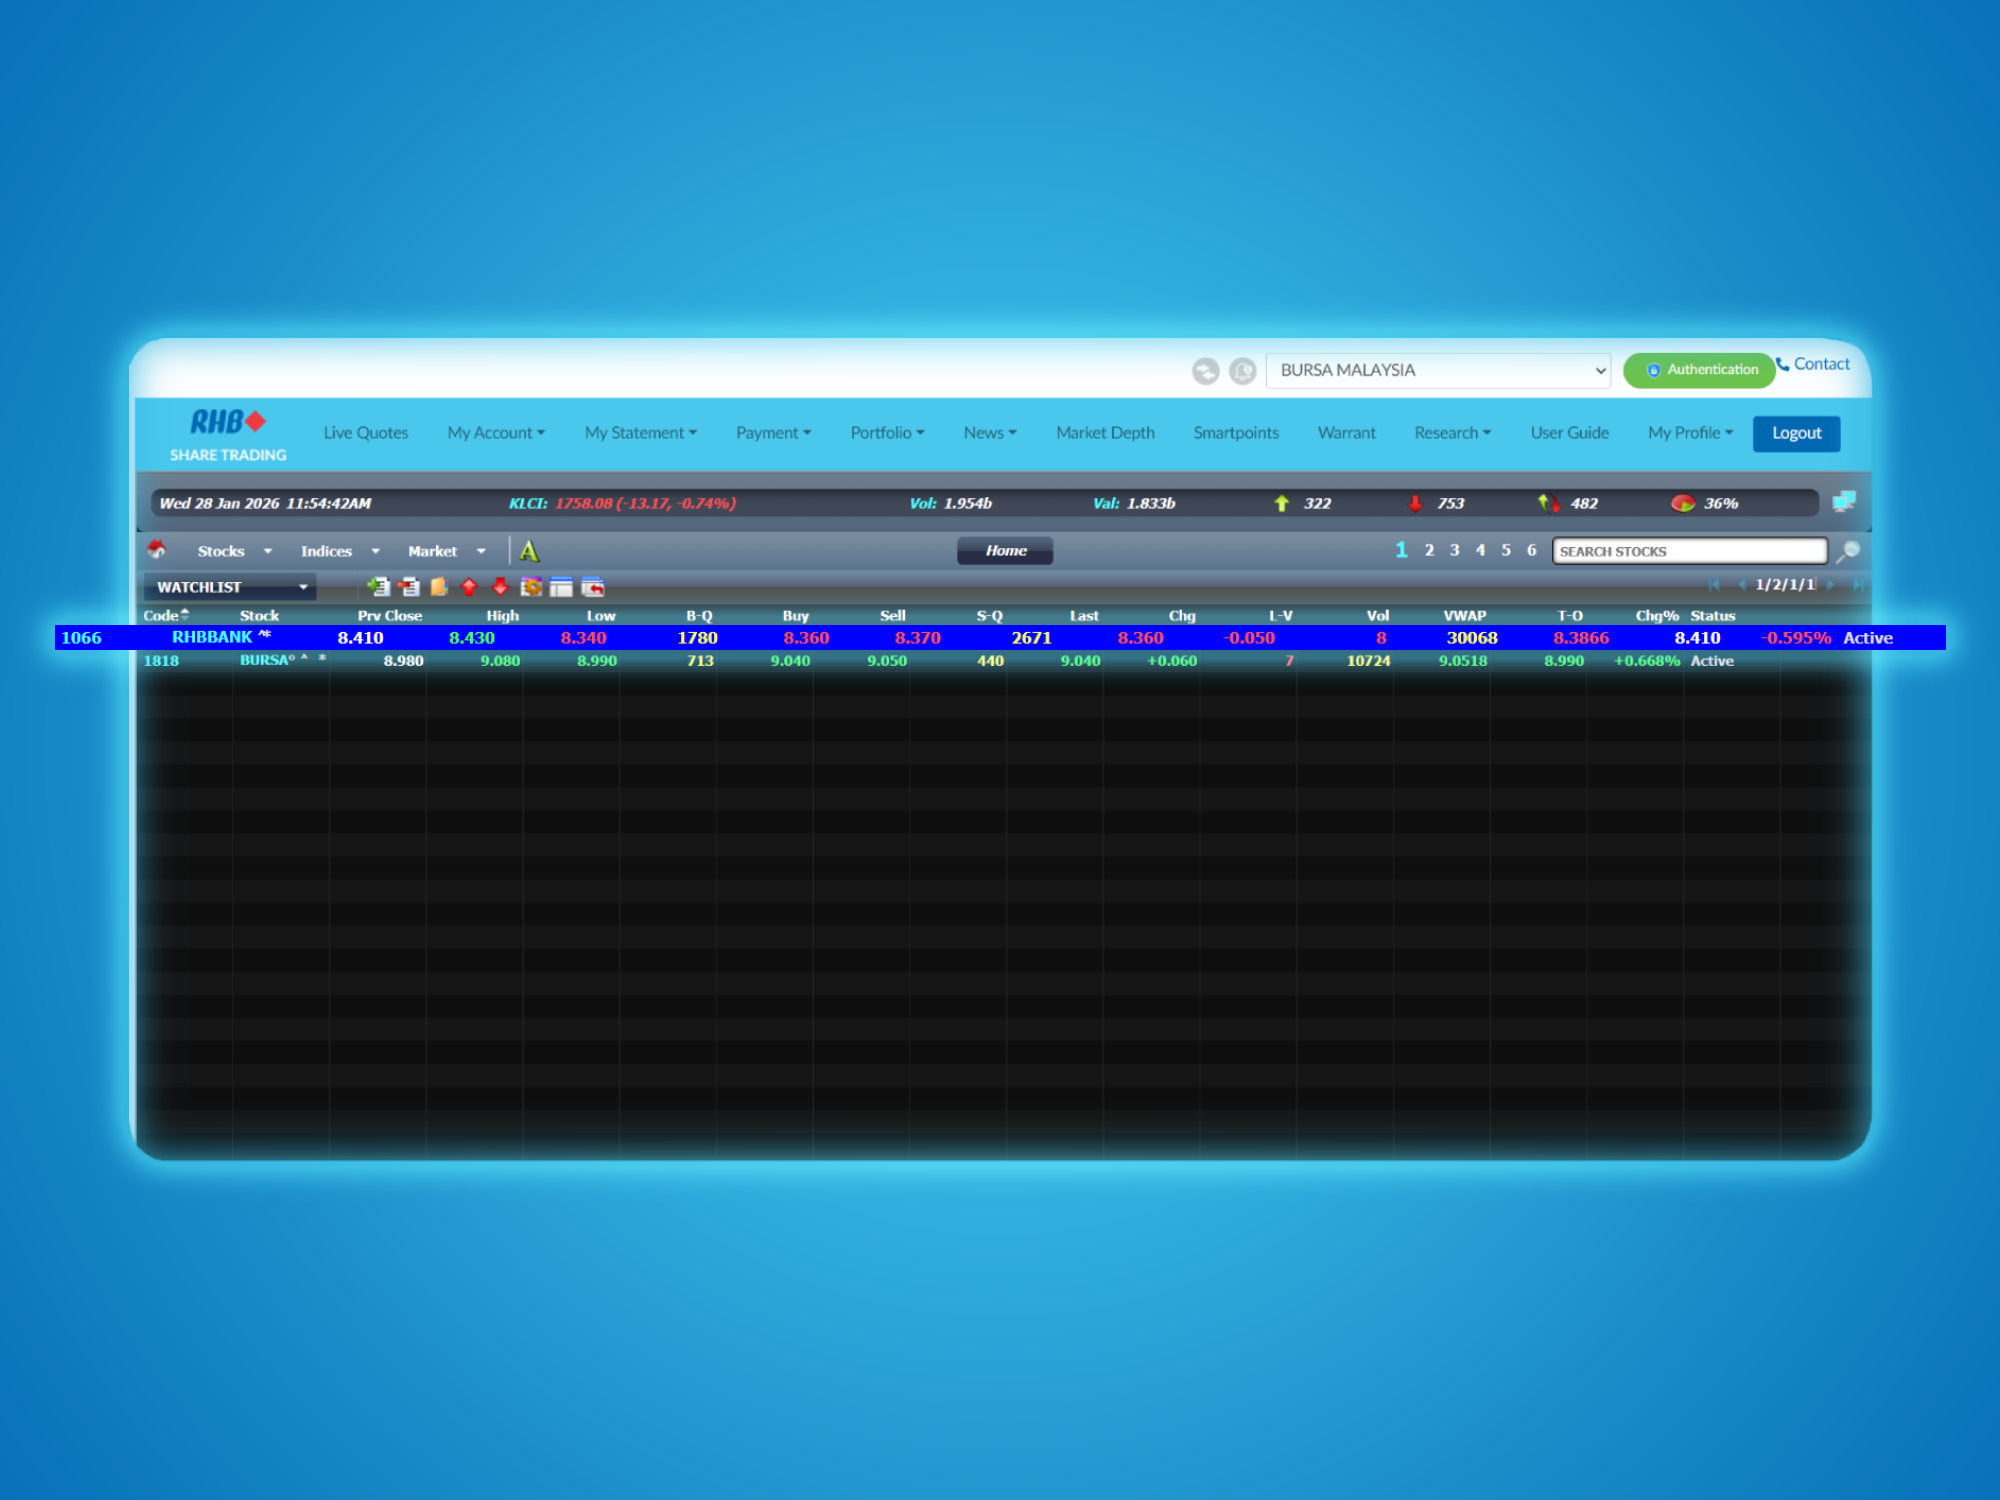
Step 2: Right-click any stock on your Live Price page.
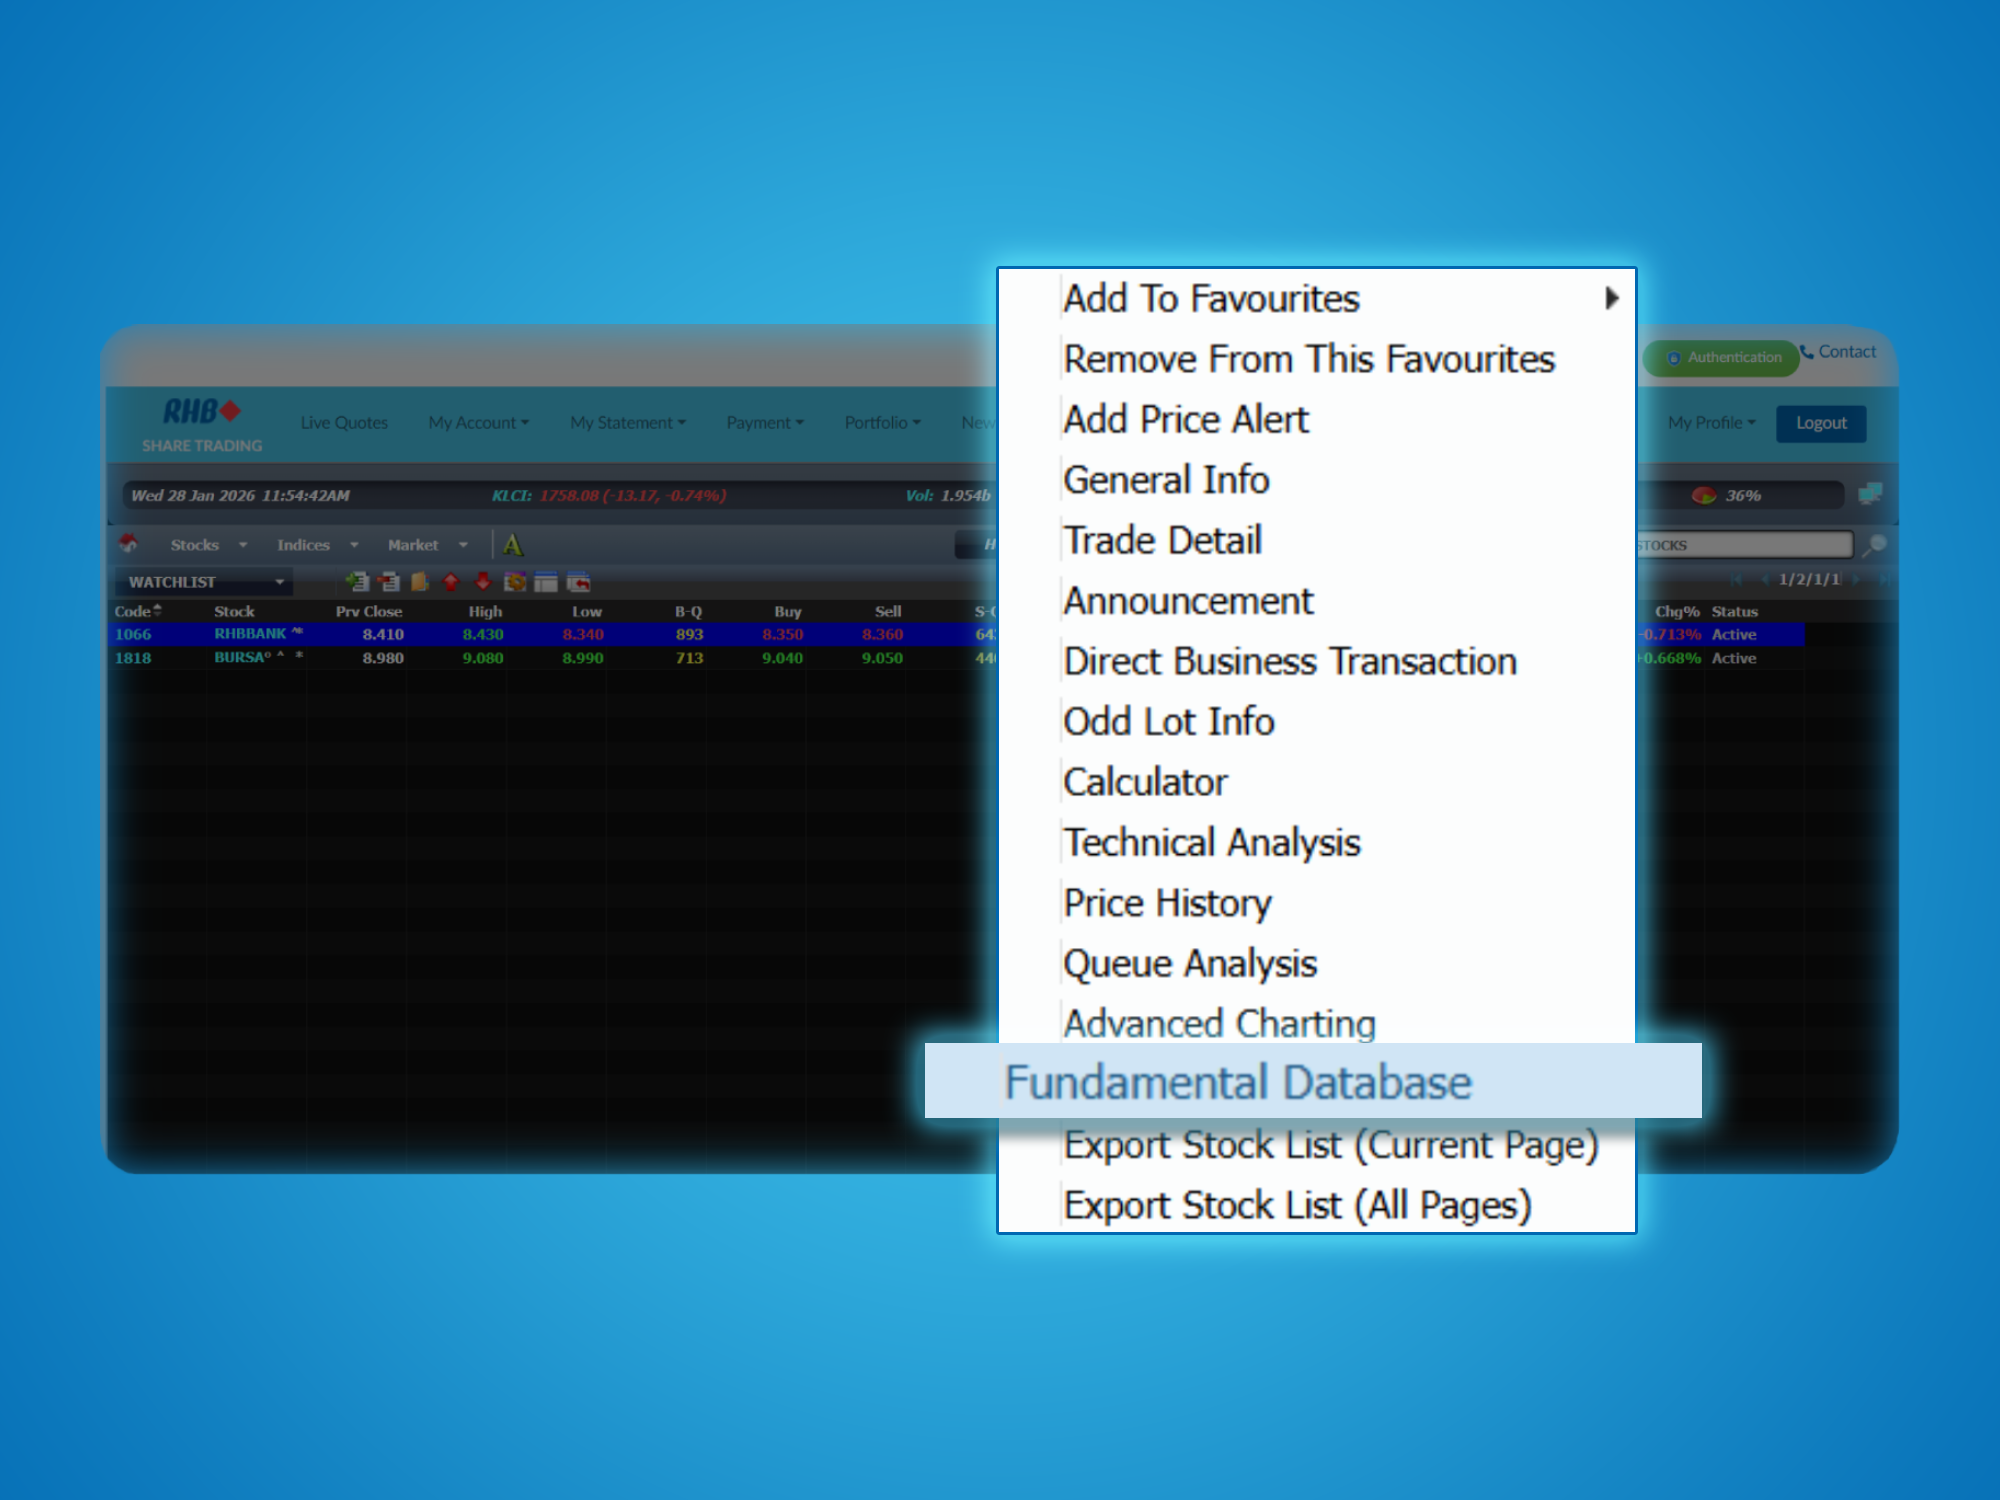
Step 3: Select Fundamental Database from the menu.
Step 1: Log in to your TradeSmart account
Step 2: Right-click any stock on your Live Price page.
Step 3: Select Fundamental Database from the menu.
Technical Charting Tools
Whether it's to spot trading opportunities, analysing the past or predicting future price trends, RHB Share Trading has 25 technical indicators that were custom built to meet your specific needs:
The use of these technical indicators is to serve 3 broad functions: to alert, confirm and predict.
In addition to the technical indicators, RHB Share Trading also provides access to detailed company information and financial reports to help online traders corroborate technical interpretation with fundamental analysis.